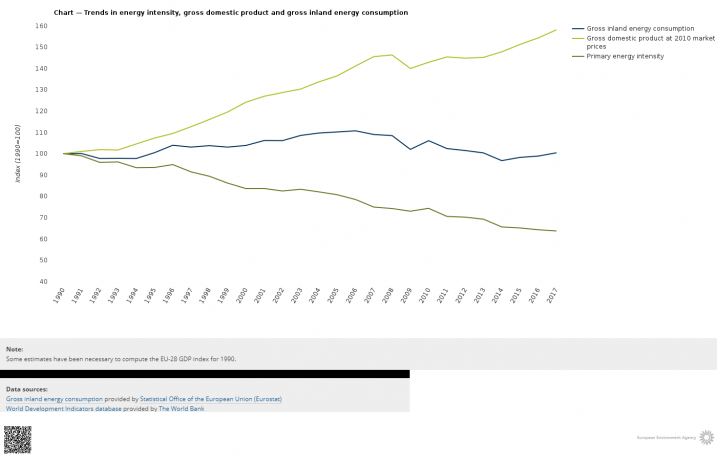
3 Pros:
• Trends easily show “progress”, even if it is just “normal evolution”
• Nice correlations exist: E/cap & GDP/cap
• The overall structural evolution is pictures by one overall parameter
3 Cons:
• Covers both change in economic sectors and actual improvement of efficacity
• Needs careful interpretation
• Industrial and economic structures take decades to improve