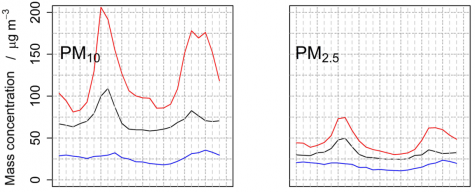
1. Time lines for single gases
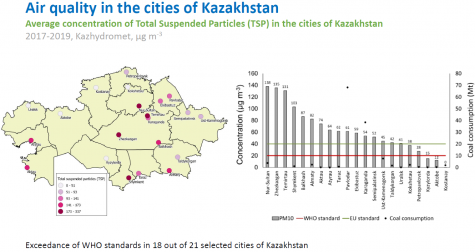
2. National maps and bar charts
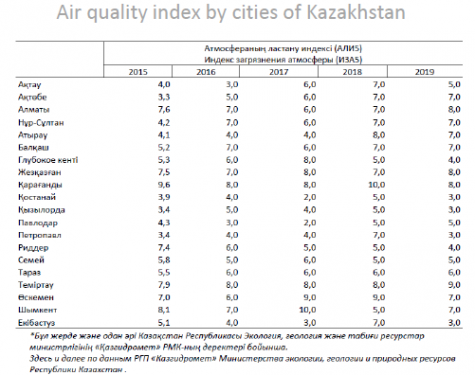
3. Tables for single cities
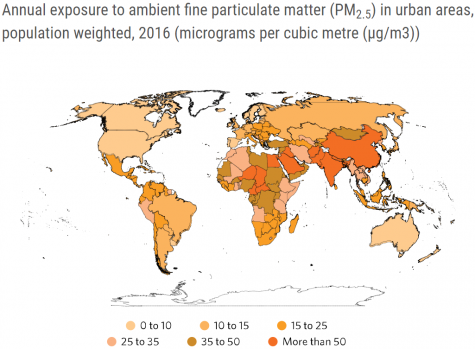
4. Global maps with coloured labels
_______________________________________________________
Sources:
- https://acp.copernicus.org/articles/18/15403/2018/acp-18-15403-2018.pdf
- slide 3 in the presentation at the UNECE/UNEP -First regional webinar on “First regional webinar on Health effects of air pollution“ by Aiymgul Kerimray on Air quality in cities of Kazakhstan. December 16th, 2020, or https://www.tandfonline.com/doi/full/10.1080/10962247.2020.1813837
- slide 3 in the presentation at the UNECE/UNEP -First regional webinar on “First regional webinar on Health effects of air pollution“ by Aiymgul Kerimray on Air quality in cities of Kazakhstan. December 16th, 2020, or https://www.tandfonline.com/doi/full/10.1080/10962247.2020.1813837
- http://aqicn.org/city/all/